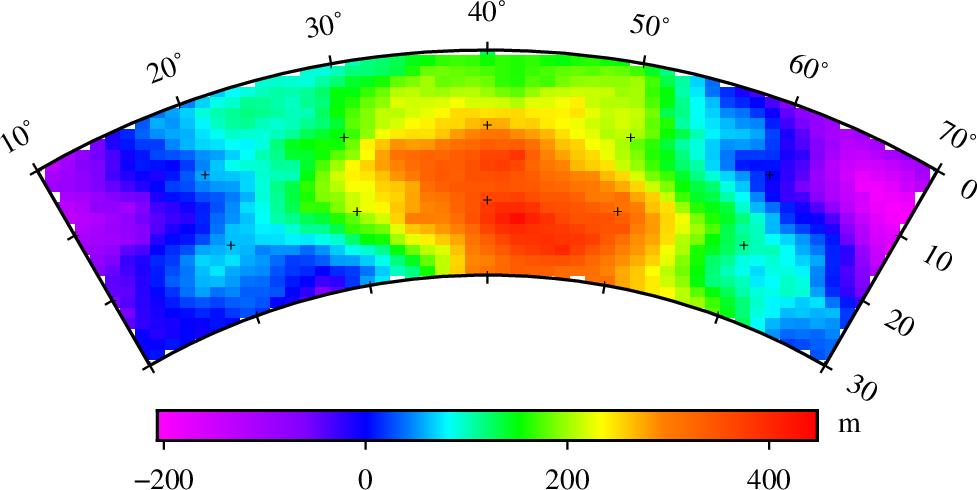
gmtsph-profile 是一个 shell 脚本,基于 GMT5 在极坐标系下绘制 2D 网格数据的垂直剖面图,用于快速浏览 .nc 或 .grid 文件。对于更精细、定制化的需求,仍然需要自行编写脚本。
安装
将脚本 dispOptions.sh 和 gmtsph-profile.sh 复制(或软链接)到任意一个位于 $PATH 中的目录,然后重新打开终端即可使用。
Setup 配置
请打开 gmtsph-profile.sh 文件末尾,你会看到类似下面的行:
imgcat $jpgfile #open the output file in terminal, this requires the iTerm.app and imgcat.sh
open $jpgfile #'open' is a command in-build within MacOS
可按你的环境选用其中一种。若使用 Ubuntu,可以用命令 see;其他 Linux 发行版对应的命令需自行确认。
用法
gmtsph-profile -i<grid-data> [-r<start-deg>/<end-deg>/<r>/<R>] [-u<unit>] [-c<cpt-file>] [-a<x-label>;<y-label>] [-f<offset>] [-h]
选项说明
- -i:输入网格文件名。最好使用
.nc文件,不过 GMT5 也支持 Surfer 的网格格式。 - -r:输入网格数据的范围,默认使用全部数据范围;使用此选项可强制自定义绘图范围。
- -u:输入数据的单位。
- -c:用于生成数据专属 cpt 文件的输入 cpt 文件,默认使用 GMT 的
grd2cpt命令。 - -a:用分号分隔的坐标轴标签。
- -f:剖面的偏移角度,默认使用 x 范围的平均值,这样会把 x 的平均值置于绘图中心。
- -h:显示帮助信息。
示例
用以下命令绘制 example.nc。输出文件名取自输入网格文件名,脚本会同时输出一张 png(无背景)和一张 eps 文件:
gmtsph-profile -i example.nc
输出效果如下: